Multi-Variable Comparison & Correlation Plot (MVCCP)
Checked variables will have their figure shown below. Uncheck any variable to remove its plot from below.
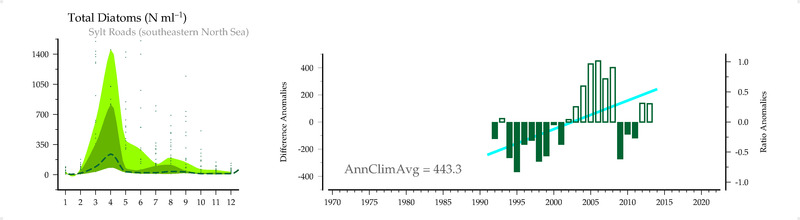
Total Diatoms (#/ml)
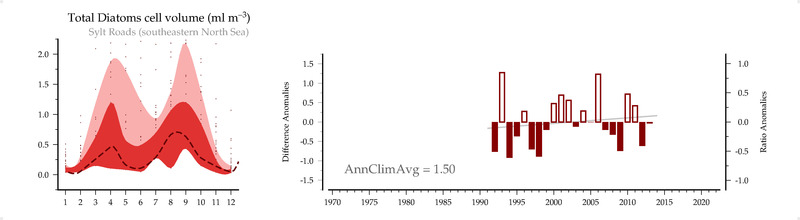
Total Diatoms cell volume (ml/m3)
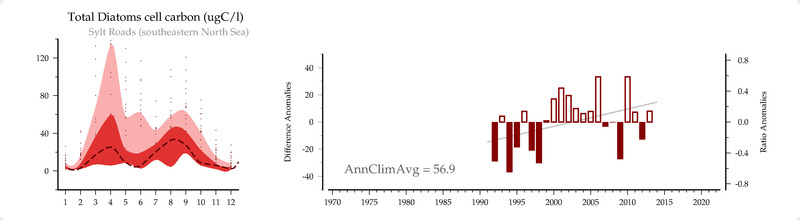
Total Diatoms cell carbon (ugC/l)
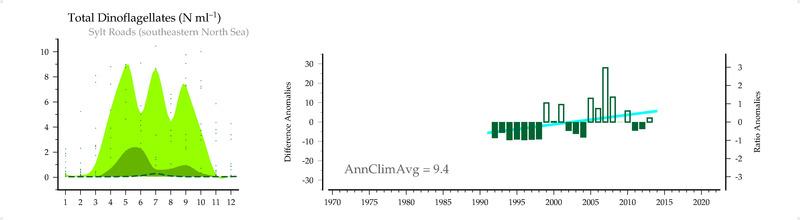
Total dinoflagellates (#/ml)
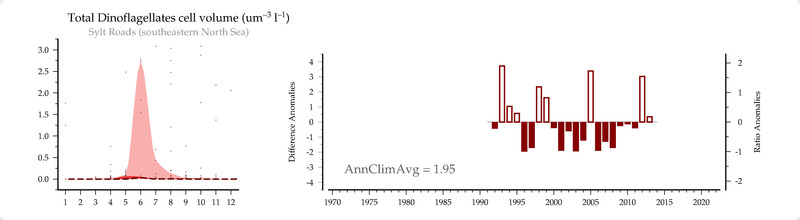
Total dinoflagellates cell volume (um3/l)
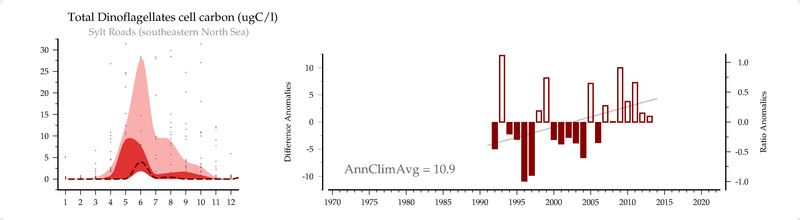
Total dinoflagellates cell carbon (ugC/l)
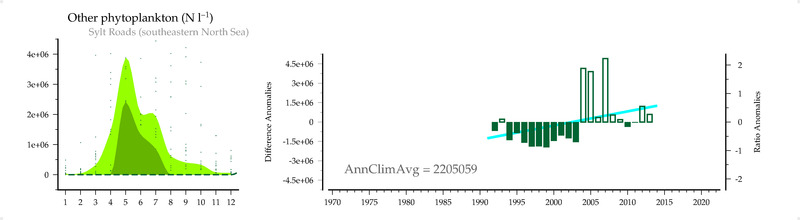
Other phytoplankton (#/l)
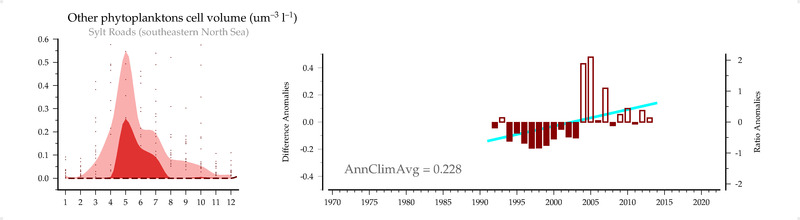
Other phytoplanktons cell volume (um3/l)
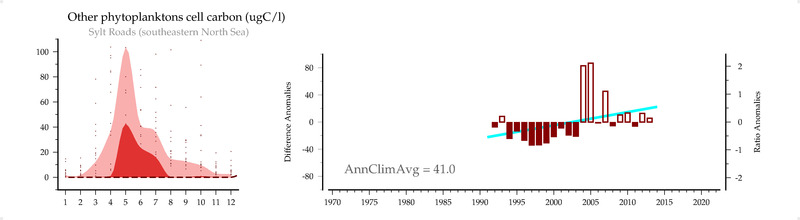
Other phytoplanktons cell carbon (ugC/l)
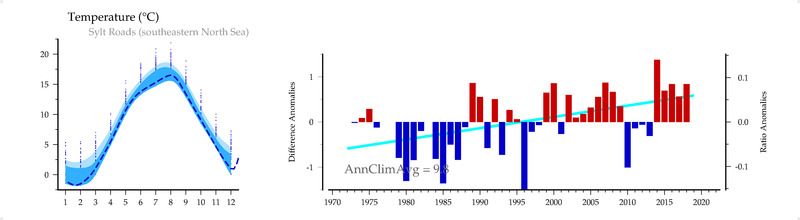
Temperature ( C )
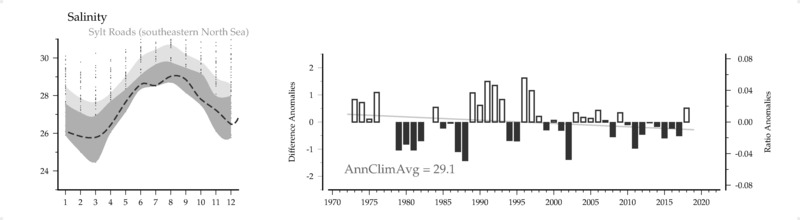
Salinity ()
pH ()
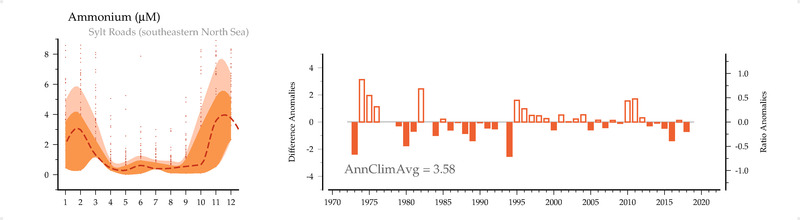
NH4 (uM)
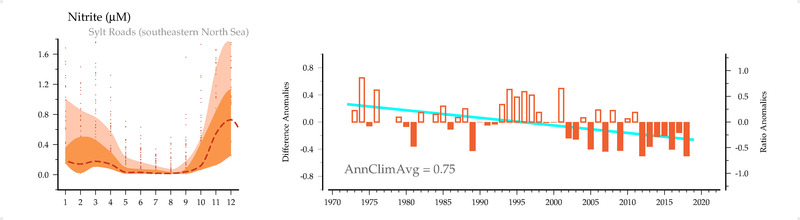
NO2 (uM)
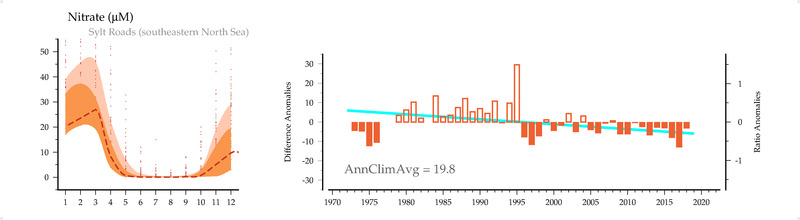
NO3 (uM)
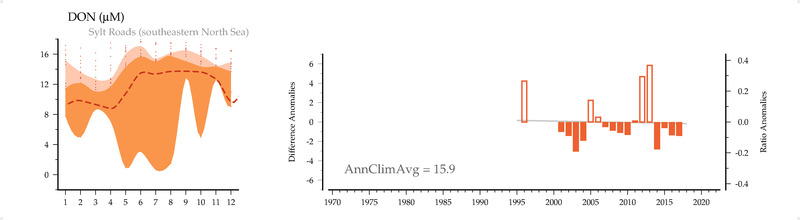
DON (uM)
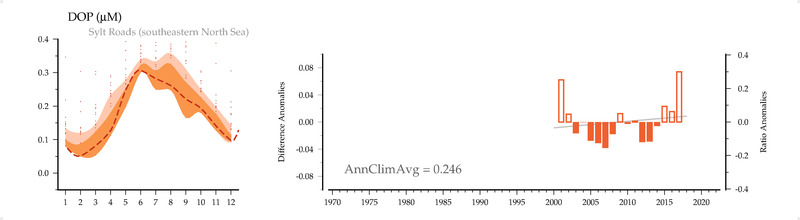
DOP (uM)
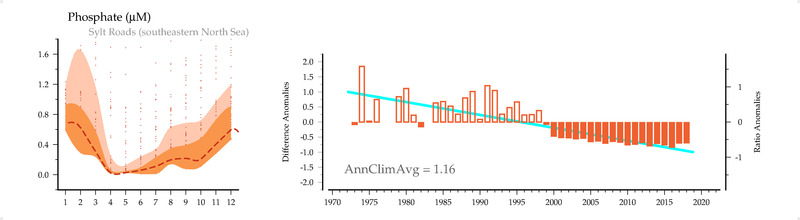
PO4 (uM)
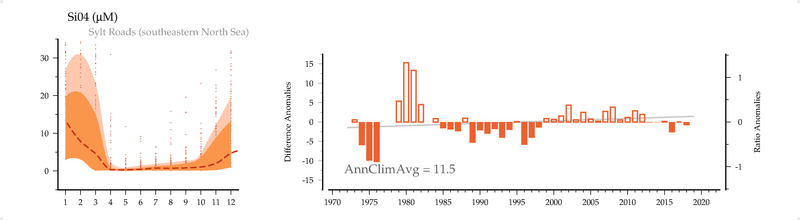
Si04 (uM)
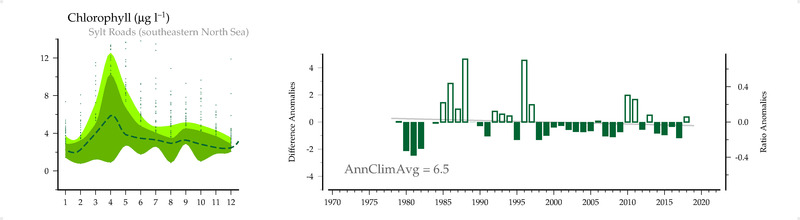
Chlorophyll (ug/l)
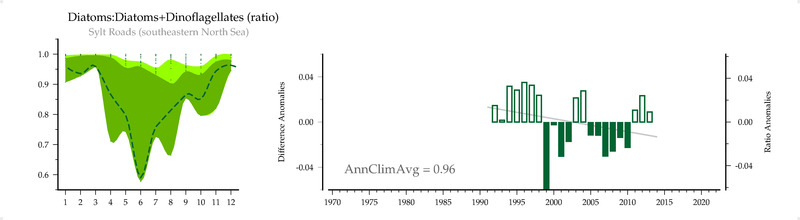
Diatoms:Diatoms+Dinoflagellates (ratio)
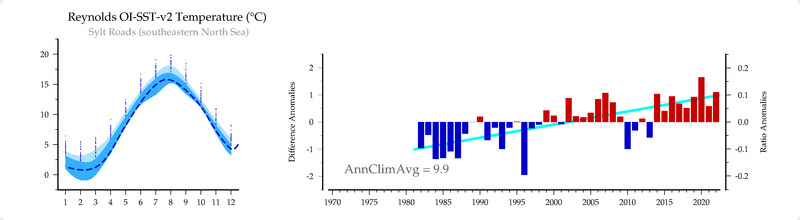
Reynolds OI-SST-v2 Temperature (C)
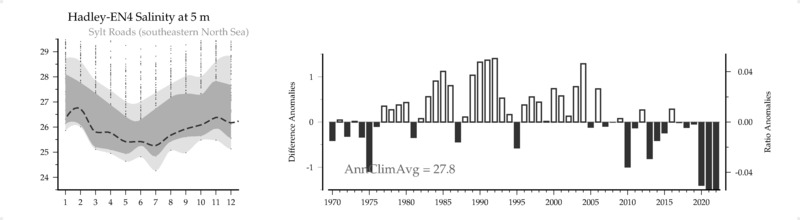
Hadley-EN4 Salinity () at 5 m
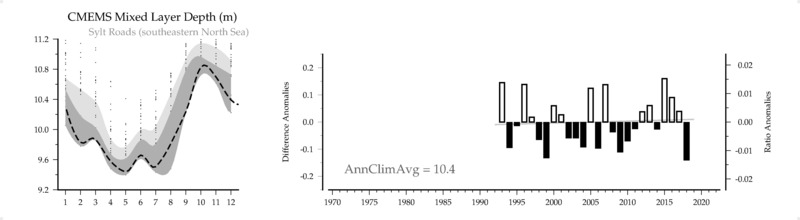
CMEMS Mixed Layer Depth (m)
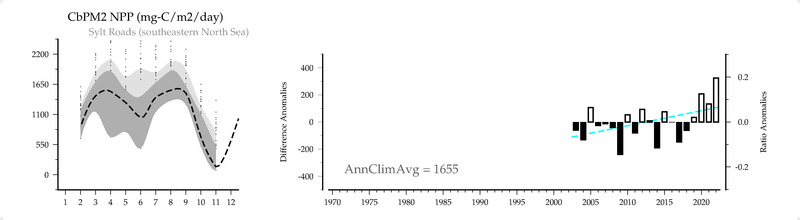
CbPM2 NPP (mg-C/m2/day)
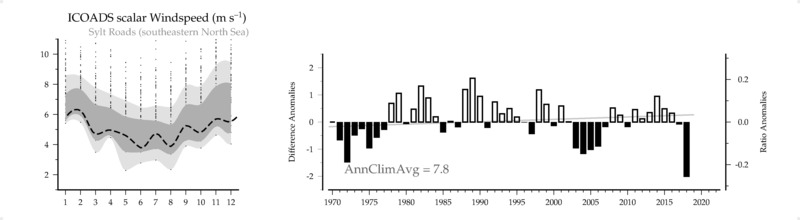
ICOADS scalar Windspeed (m/s)
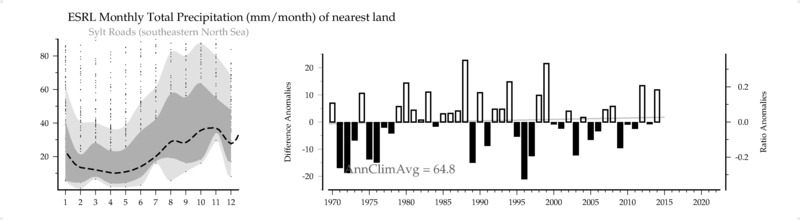
ESRL Monthly Total Precipitation (mm/month) of nearest land
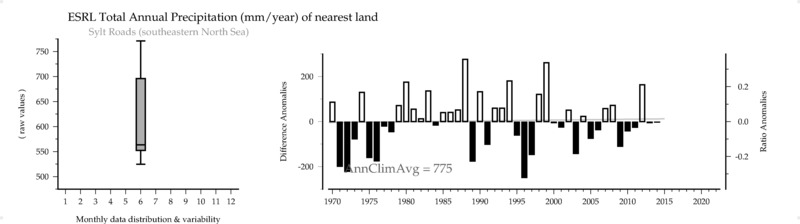
ESRL Total Annual Precipitation (mm/year) of nearest land
HadISST Sea Surface Temperature (C) from matching years
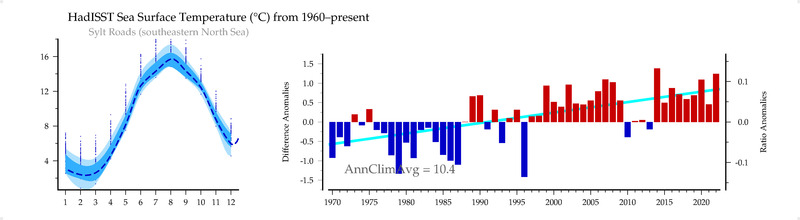
HadISST Sea Surface Temperature (C) from 1960-present
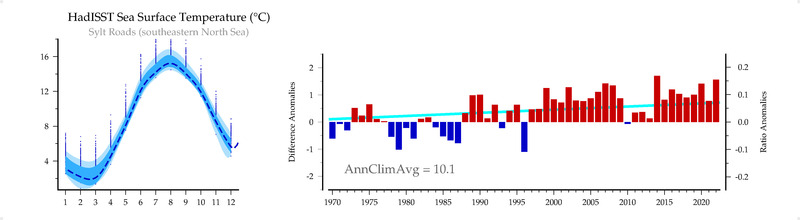
HadISST Sea Surface Temperature (C)